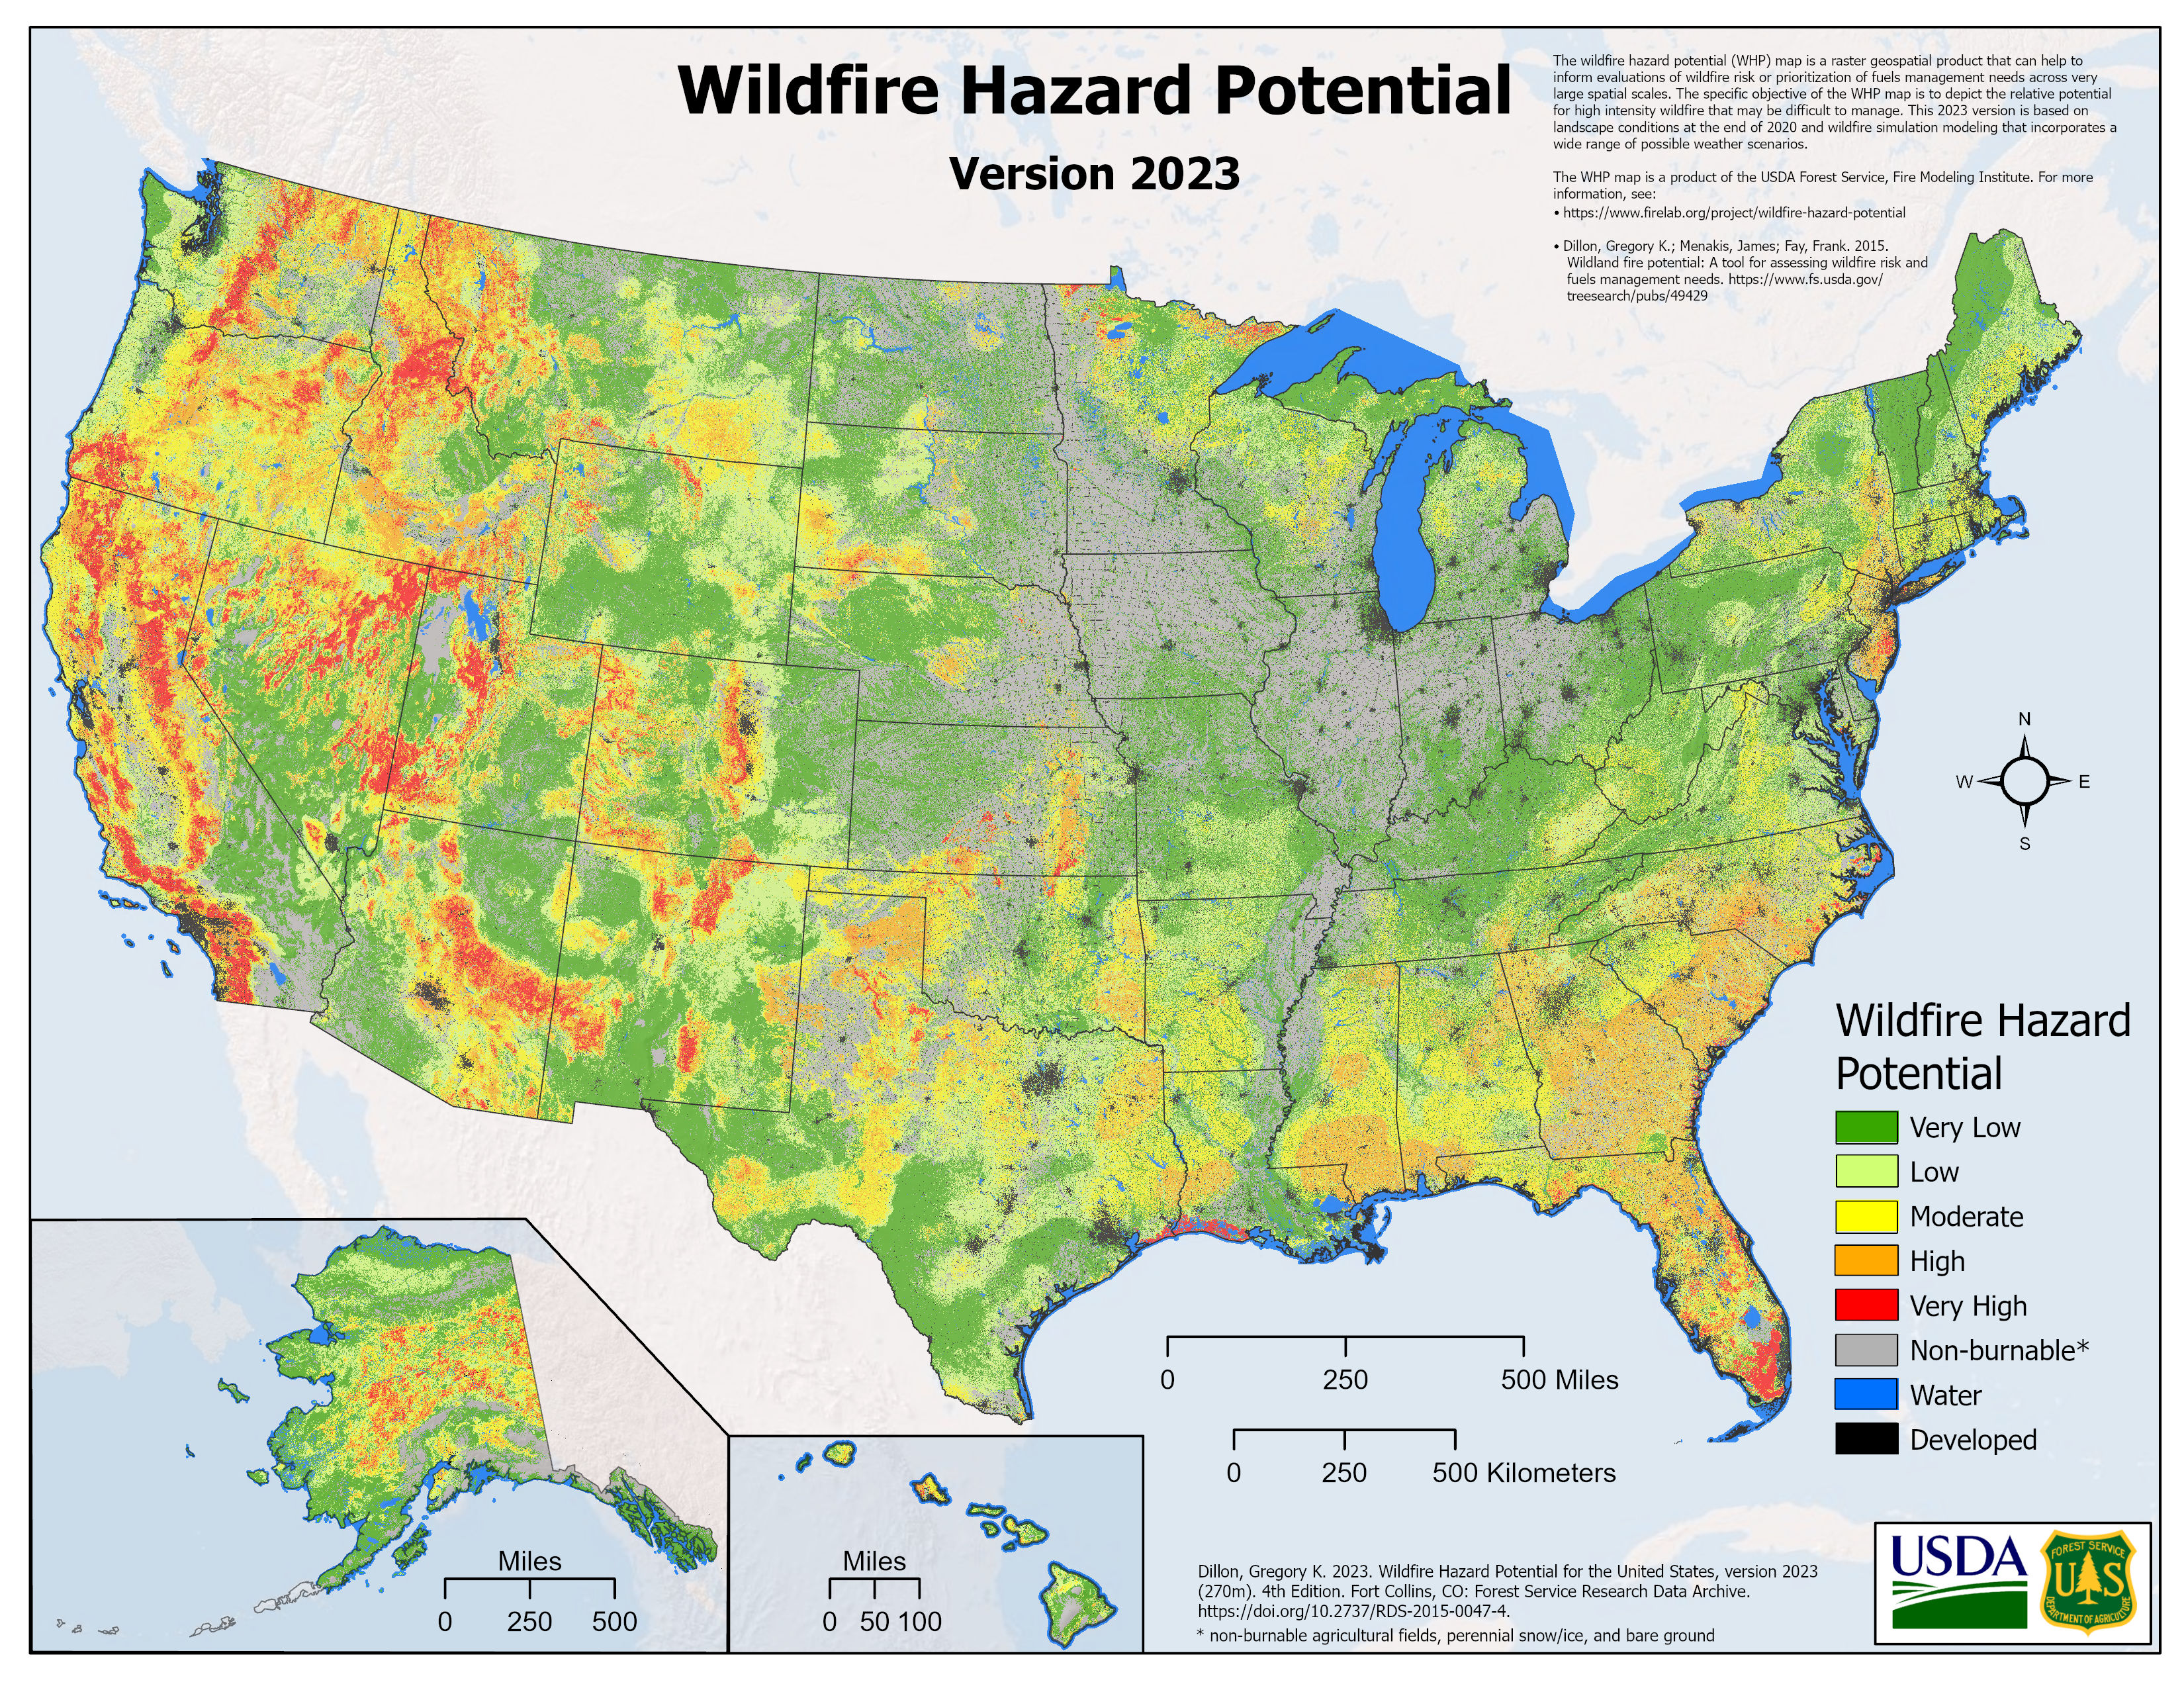
Wildfire Hazard Potential* for the United States
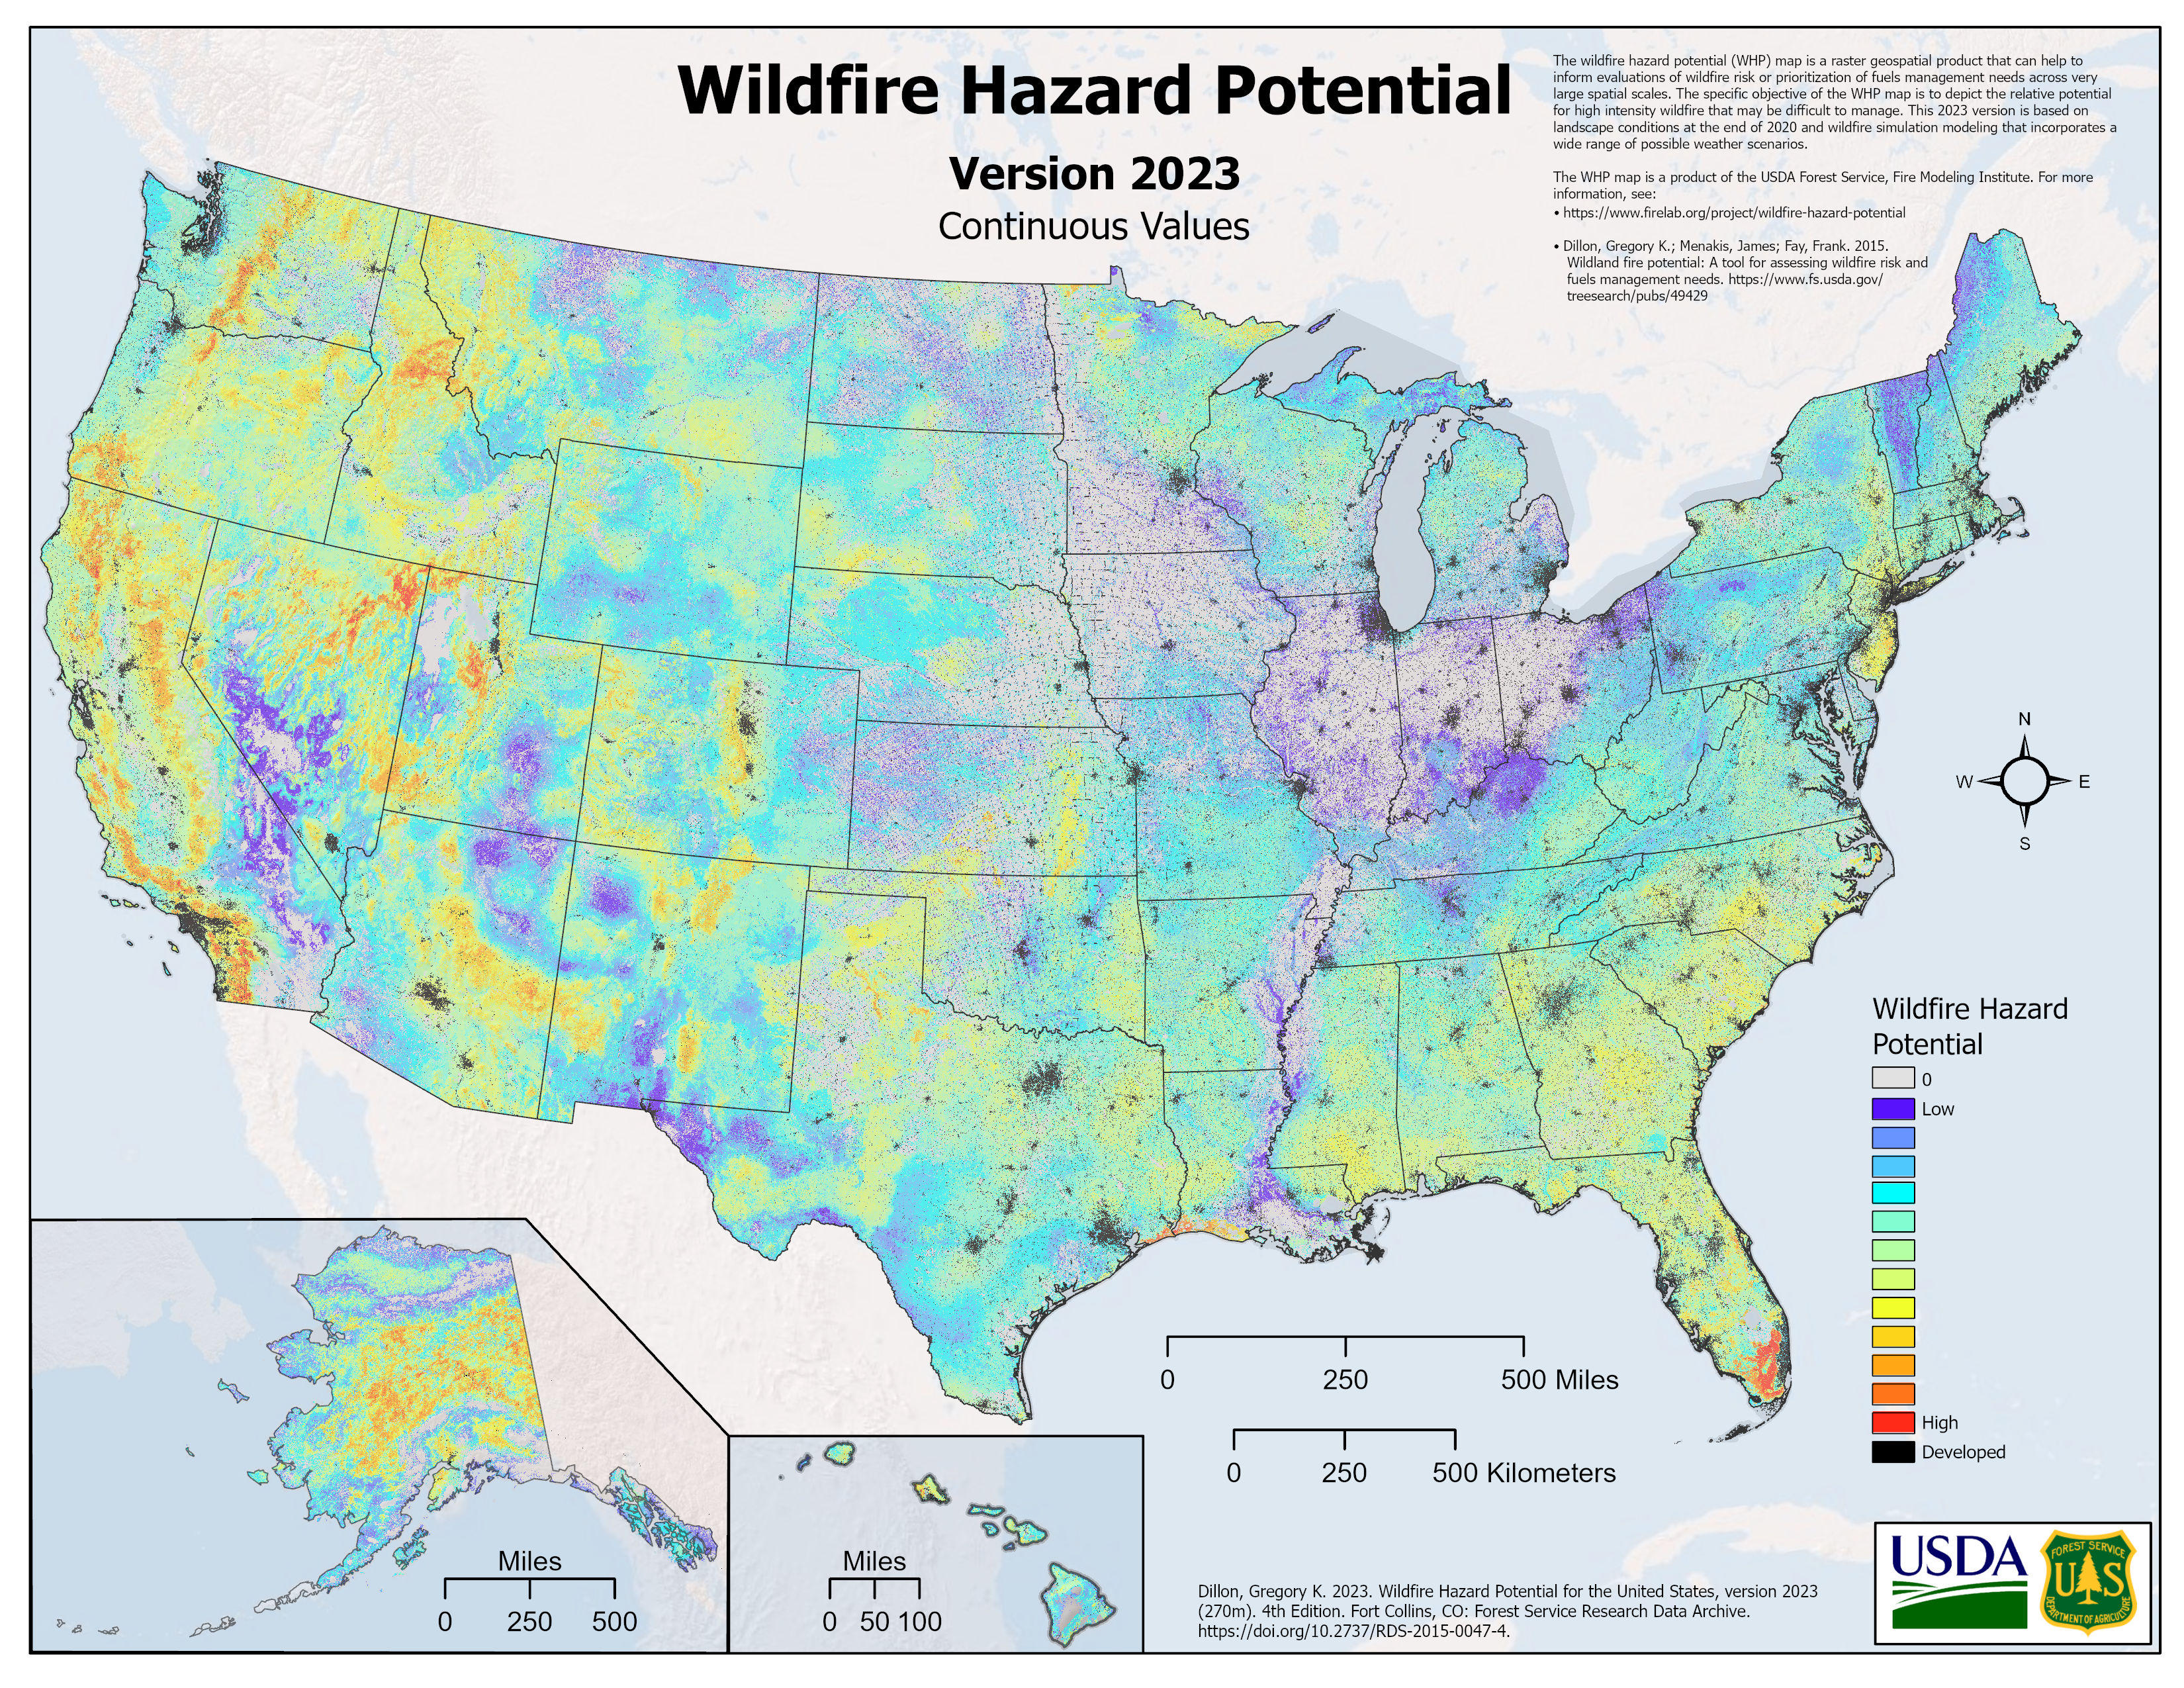
The wildfire hazard potential (WHP) map is a raster geospatial product produced by the USDA Forest Service, Fire Modeling Institute that can help to inform evaluations of wildfire hazard or prioritization of fuels management needs across very large landscapes.Our specific objective with the WHP map is to depict the relative potential for high-intensity wildfire that may be difficult to manage. To create the 2023 version, we built upon spatial datasets of wildfire likelihood and intensity generated with the Large Fire Simulator (FSim), as well as spatial fuels and vegetation data from LANDFIRE 2020 and point locations of past fire occurrence (ca. 1992 - 2020). With these datasets as inputs, we produced an index of WHP for the United States at a 270-meter resolution. We present the WHP map in two forms: 1) continuous integer values, and 2) five WHP classes of very low, low, moderate, high, and very high. Areas mapped with higher WHP values represent fuels with a higher probability of experiencing torching, crowning, and other forms of extreme fire behavior under conducive weather conditions, based primarily on landscape conditions at the end of 2020.
On its own, WHP is not an explicit map of wildfire threat or risk. Its primary purpose is to highlight places where vegetation treatments may be needed to reduce the intensity of future wildfires. It is one of several factors used to prioritize limited fuel treatment resources. WHP is a tool for long-term strategic planning, but it is not a forecast or wildfire outlook for any particular season, as it does not include any information on current or forecasted weather or fuel moisture conditions.
To download national 270-m raster GIS data, please visit the Forest Service Research Data Archive.
Starting with the 2020 version, the WHP dataset is integrated with the Wildfire Risk to Communities project. The 2020 dataset was the first version to include Alaska and Hawaii. There is a spatially-refined, 30-m resolution version of the WHP as part of the downloadable Wildfire Risk to Communities data, and related datasets that depict other components of wildfire hazard and risk to homes.
To view previous versions of the WHP and WFP products, please visit the Wildfire Hazard Potential Archived Products page.
*Versions of this product prior to 2014 were known as the Wildland Fire Potential (WFP) map.